Advanced Analytics
Know what's working, and what to do next.
Tracking, dashboards and forecasting your leadership team will actually use.
- Typical timeline
- 3–8 weeks for a first set of dashboards.
- How we work
- Fixed-scope build, then optional monthly analytics support.
01 /Overview
Advanced Analytics
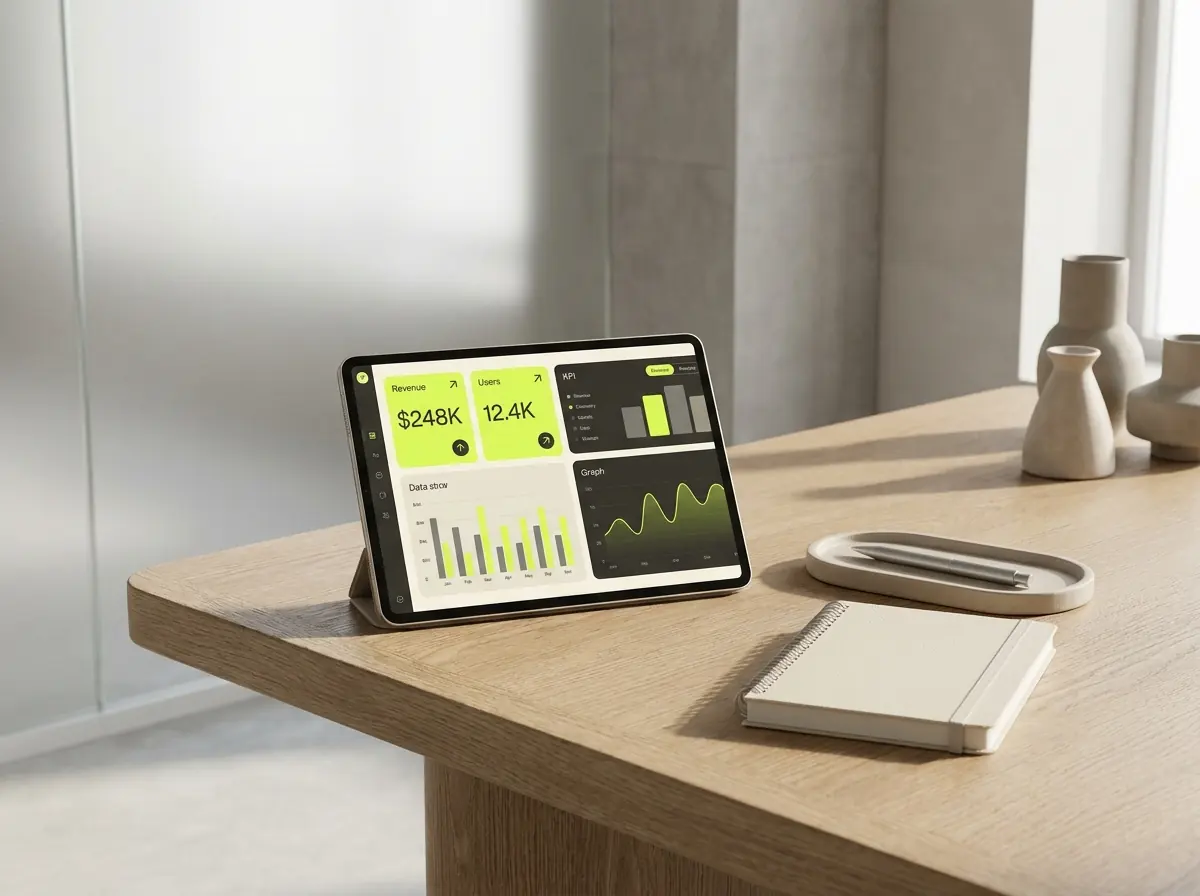
Advanced analytics is turning scattered business data into clear answers: which channels drive revenue, where customers drop off and what next quarter is likely to look like. Sepiora builds data pipelines, BI dashboards and predictive models for growing companies.
We begin with the decisions you need to make, then connect the right sources, clean the data and design dashboards around a handful of metrics that matter.
02 /What you get
Everything you need.
Under one roof.
- 01
Metrics framework
The questions, KPIs and definitions your team agrees to measure.
- 02
Tracking & data quality
Event tracking, consent mode and validation so the numbers can be trusted.
- 03
Data pipelines
Automated ETL from your apps, ads, CRM and finance tools into one warehouse.
- 04
Dashboards
Role-based dashboards for leadership, marketing, sales and operations.
- 05
Predictive models
Forecasts, churn risk and lifetime-value models that guide spend.
- 06
Enablement
Training and documentation so your team can answer new questions on its own.
03 /How we work
Six steps.
No surprises.
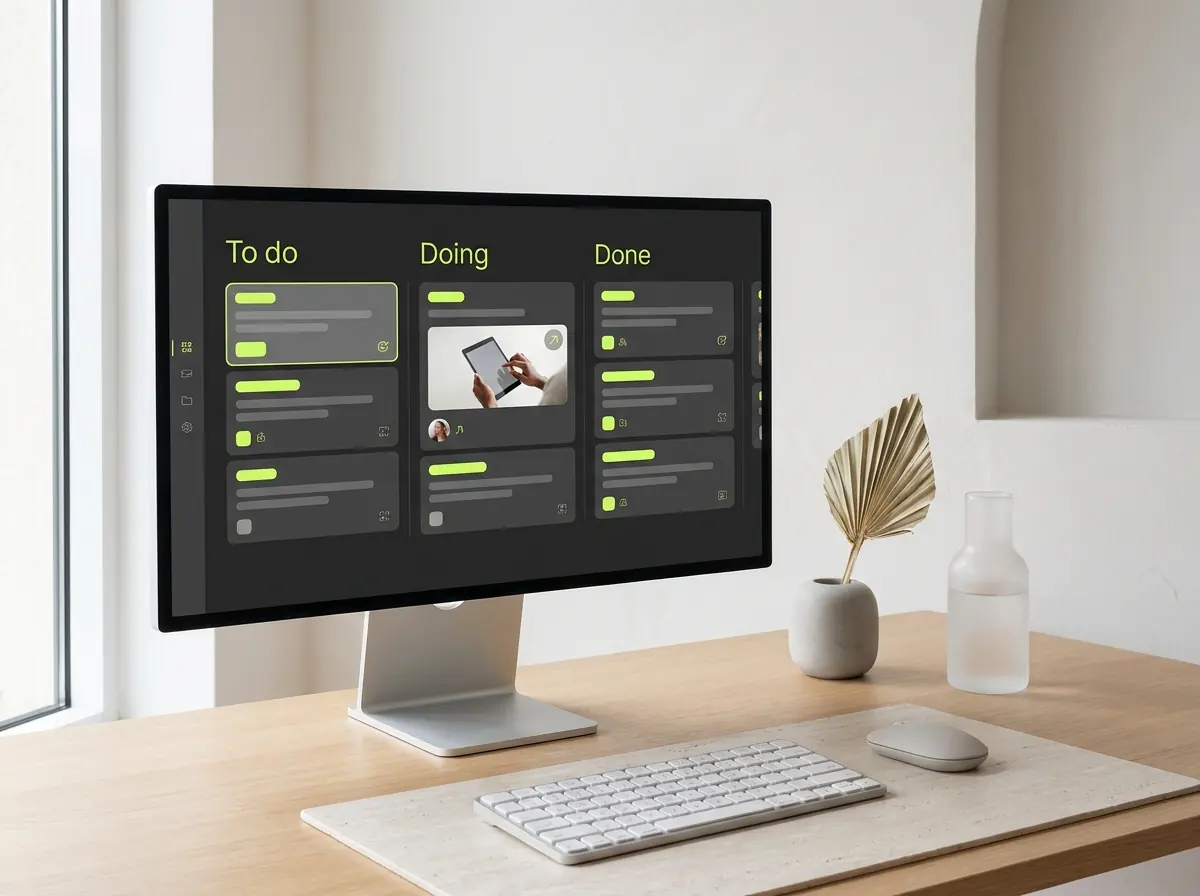
A demo at the end of every sprint, written updates in your time zone and one shared board for everything.

- 01
Discover
We map goals, users and constraints, then agree scope, architecture and a roadmap before any code is written.
- 02
Design
Wireframes and clickable prototypes you can test early, so the product feels right before it is built.
- 03
Build
Short sprints with clean, documented code and a working demo at the end of every one.
- 04
Test
Automated and manual QA across devices, performance and security for a calm, predictable release.
- 05
Launch
Monitored deployment, analytics and full handover documentation, so you go live with confidence.
- 06
Grow
Ongoing support, optimisation and new features as your business and your users evolve.
04 /Technology
Tools we use for analytics
- BigQuery
- Snowflake
- dbt
- Looker Studio
- Power BI
- Metabase
- Python
- GA4
05 /Industries
Where this work makes the biggest difference
- Retail & E-commerce
- SaaS & Startups
- Finance & Fintech
- Logistics
- Healthcare
- Manufacturing
06 /FAQs
Analytics,
answered.
We already have Google Analytics. Why do we need more?
Web analytics shows behaviour on your site. Revenue decisions need it joined with CRM, ads, product and finance data, which is what a warehouse and dashboards give you.
Which BI tool should we use?
Looker Studio is cost-effective for marketing data, Power BI suits Microsoft-centric companies and Metabase is great for product teams. We'll recommend one based on your stack and budget.
Is our data kept private?
Yes. Data stays in your own cloud accounts, access is role-based and we follow GDPR and regional privacy requirements.
Can you build forecasts?
Yes. Once historical data is clean we build forecasting and churn models and explain their accuracy in plain language.
How long before we see dashboards?
A first useful dashboard usually lands within three to four weeks, with more added as sources are connected.
07 /Related services
Often paired with

Digital Marketing & AI Search
SEO, AI search visibility, paid media and content that bring in qualified leads, measured against revenue, not vanity metrics.
Software Development & Integration
Custom platforms, portals and internal tools, plus the ERP, CRM and payment integrations that connect them.

E-commerce Solutions
Storefronts, checkout, payments and inventory, built on Shopify, WooCommerce or headless stacks that grow with your catalogue.
08 /Start a project
Have a challenge?
Let’s build what’s next.
Tell us what you’re planning. You’ll get a reply within one business day, in your time zone, with honest next steps and a ballpark figure.
Already have a website or store? Get a free audit with clear, prioritised fixes.